A Guide to Jakarta's Silent Killer
A Guide to Jakarta's Silent Killer
(AN | 31/08/2021)
Jakarta is the busiest city in Indonesia due to its role as the center of administration, social and government. It is also the most densely populated region in the country, with more than 10 million people living in the greater Jakarta region. It is rare for the sky to be clear as the city struggles with a dangerous level of air pollution caused mainly by transport, residential emissions, and coal-fired power plants [1]. There are many different types of air pollutants, such as gases (carbon dioxide, sulfur dioxide, methane, etc.), particulates, and biological molecules. Air pollution may cause disease, allergies, and even death to humans and other living organisms. Productivity losses and degraded quality of life caused by air pollution are estimated to cost the world economy $5 trillion per year [2]. To reduce these impacts, both international and national legislation and regulations have been implemented. But have we, Indonesia, done enough?
Jakarta was named the world’s most polluted city in 2019 (based on Air Quality Index recorded on August 8, 2019). The capital has several times been in the first place according to air quality monitoring software companies, surpassing notoriously polluted cities like Shanghai in China, Karachi in Pakistan, or Dubai in UAE (according to Airvisual, 2019). Meanwhile, the number of known emitters like coal-fired power plants, transport vehicles, and manufacturing facilities has increased rather than developing renewable energy source. Indonesia was the only country in Southeast Asia to start construction of a new coal-fired power plant in the first six months of 2019 (according to a report from Global Energy Monitor) and become the world’s biggest exporter of thermal coal and accounts for almost 90% of Southeast Asia’s coal production. Indonesia also has plans for an additional 31,200 MW of coal generation capacity, 20% of which will be located within a 100 km radius of Jakarta and will have air quality impacts equal to adding 10 million more cars to Jakarta [3].
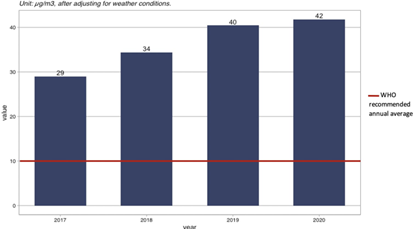
In the year 2020, mobility restrictions imposed in response to the COVID-19 pandemic have resulted in drastically reduced traffic in Jakarta, but this hasn’t necessarily led to an improvement in air quality as depicted in Figure 1. That makes Jakarta an outlier among major world cities, with those cities seeing air quality improve significantly in line with a general decrease in urban activity. This suggests that the air pollution in Jakarta doesn’t only come from within the city and wind as meteorological variable plays major impact in air pollutant distribution.
From figure 1, we also notice that the amount of Particulate Matter <2.5 micrometers (PM 2.5) is dramatically above the World Health Organization (WHO) recommended annual average [4]. Most particles form in the atmosphere as a result of complex reactions of chemicals such as sulfur dioxide and nitrogen oxides, which are pollutants emitted from power plants, industries, and automobiles. PM 2.5 contains microscopic solids or liquid droplets that can be inhaled, get deep into the lungs and in some may even make to the bloodstream causing several lung diseases and premature death [4].
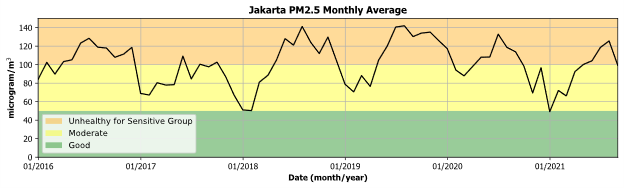
Knowledge about air pollution is much needed in the current situation as high pollution air can lead to dangerous health impacts. Figure 2 gives a clear view of PM 2.5 variation throughout the years. Although there is none “Good” month recorded, at least we can conclude that there is seasonal dependence of PM 2.5 variation. The PM 2.5 concentration is much worse in the dry season (Figure 3) as the land experience less precipitation to “wash out” the air suspended particles.
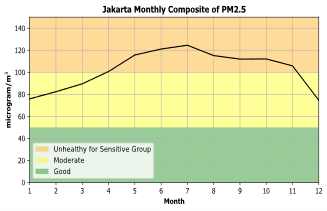
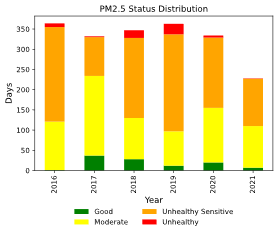
Figure 3. Monthly composite of PM2.5 levels in Jakarta (left) and PM 2.5 distribution status throughout the year (right). Data source: US Embassy AQI monitoring station.
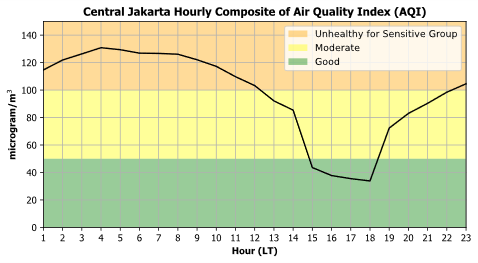
PM 2.5 also varies through the day as the height of the Planetary Boundary Layer (PBLH) or the lowest part of the atmosphere (0-3000 m in equator) changes. PBLH is a key factor in the vertical mixing and dilution of near-surface pollutants. The behavior of PBLH is directly influenced by earth’s surface. PBLH is high during the day due to solar heating can lead to an unstable atmosphere and generate mixing. Based on this fact, apparently, early morning is not the best time to do outdoor activities as PBLH is in the beginning stage of development, even though human being falsely feel that this time is the freshest air one could obtain. The best time to do outdoor activity in Jakarta is around 15-18 local time as the level of Air Quality Index (AQI) are relatively “Good” (Figure 4).
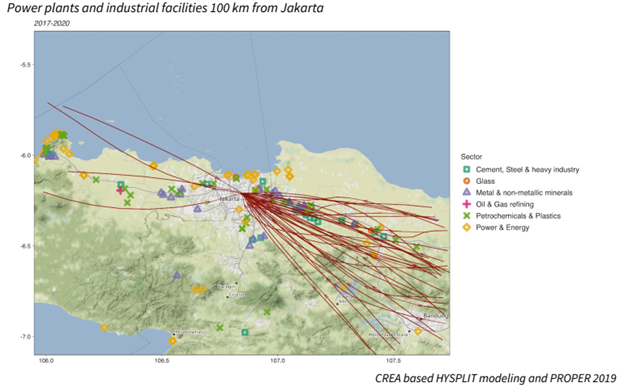
To reveal Jakarta’s pollutant sources and simulate wind driven distribution, the Centre for Research on Energy and Clean Air (CREA) used the Hybrid Single-Particle Lagrangian Integrated Trajectory (HYSPLIT) model developed by the National Oceanic and Atmospheric Administration (NOAA) to generate the distinct patterns of airflow and wind trajectories during pollution peaks (when PM 2.5 was over 90 micrograms/m3) in 2017-2020. Figure 5 shows that the wind trajectories entered Jakarta brought in pollutants from industries in Surabaya and Tangerang as well as from industries in West Java, starting from the cluster of facilities on the eastern border of Jakarta and extending to West Karawang, Purwakarta, and Bandung.
Air pollution should be a manageable problem. Prioritizing the necessary measures to protect Indonesian citizens’ right to breath clean air require appropriate policies to regulate and monitor air quality and pollution from major source, especially from industries as well as thermal power plant. Simulation done by CREA shows the importance of a meteorological study, especially for wind trajectory should be conducted as part of environmental assessment (AMDAL) before developing new facilities to minimize dangerous impact against living organisms caused by air pollution.
References:
[1] Greenpeace 2017. Jakarta’s Silent Killer: How the city’s dangerous levels of air pollutions are about to get even worse. Greenpeace Southeast Asia – Indonesia.
[2] CREA 2020. Transboundary Air Pollution in the Jakarta, Banten, and West Java provinces. Centre for Research on Energy and Clean Air. Jakarta: CREA, August 2020. energyandcleanair.org.
[3] WHO 2016. Health risk assessment of air pollution – General principles. World Health Organization. Copenhagen: WHO Regional Office for Europe, 2016. https://www.euro.who.int/__data/assets/pdf_file/0006/298482/Health-risk-assessment-air-pollution-General-principles-en.pdf
[4] Lowy Institute 2019. Jakarta’s air quality kills its residents – and it’s getting worse. The interpreter, Kate Walton. www.lowyinstitute.org/the-interpreter/jakarta–s–air–quality–kills–its–residents–and–it–s–getting–worse