Alternative Format of Operational Time Window for Your Best Solution
Alternative Format of Operational Time Window for Your Best Solution
(SC | 07/11/2022)
As we already know, large-scale offshore operation and maintenance activities are performed under certain limitations. One of its limitations is about metocean variables, which include wind speed, wave height, current speed, precipitation (rainfall), etc. By that, it is necessary to assimilate its behavior as we need to plan a proper consideration before executing the activities. A great preparation would help us to evade severe damage or loss and their consequences. Any damage could be from storm, severe weather, higher metocean condition than the designed criteria, that lead into deteriorate equipment performances and obstruct maintenance operations. Other cases are when we need judgment in the possibility to conduct operation. It is to plan which equipment or vessel to be planned or considered. Thus, a knowledge of uptime probability is important.
Weather window is one of BW Geohydromatics’ specialties to support decision-making in marine operations especially on long term outlook decision. Our weather window provides uptime probability as a summary to conclude the “best time” for operation based on historical or hindcast data (this is a different product with forecast). To make it clear, the service gives explanation on the “window” of period that is “safe” for offshore activities. The weather window is on basis of 1 to 30 uptime consecutive days with certain applied thresholds (e.g., significant wave height, wind speed at 10 m, surface current speed, precipitation, etc.) according to the client’s preference. The uptime probability is calculated as the amount of “safe” event, defined as the event that is below the applied threshold, to the total amount of considered event.
The application of weather window is quite easy. For example, we got an information that the probability to conduct operation in the beginning of March is very low. The low probability gives us an information that the metocean condition in the beginning of March is far above the acceptable value. By them, we will be able to deal with the “bad” condition, by prepare the most suitable and effective quality of equipment, vessel, or operation plan.
Our operation time window has helped our client to determine the period range to conduct their execution plan. It is certain that the uptime probability would decrease with the increase of the uptime days. But we can approximate the probability and conclude the most possible period can be performed in each month. The below Figure 1 shows you the example of the generated uptime probability information on basis of 1 to 30 uptime days for each month. This is how this form is read: During January, the uptime probability to have a safe operation for 1 day is 92.04%, for 2 consecutive days is 88.82%, and until for 30 consecutive days is 40.86%.

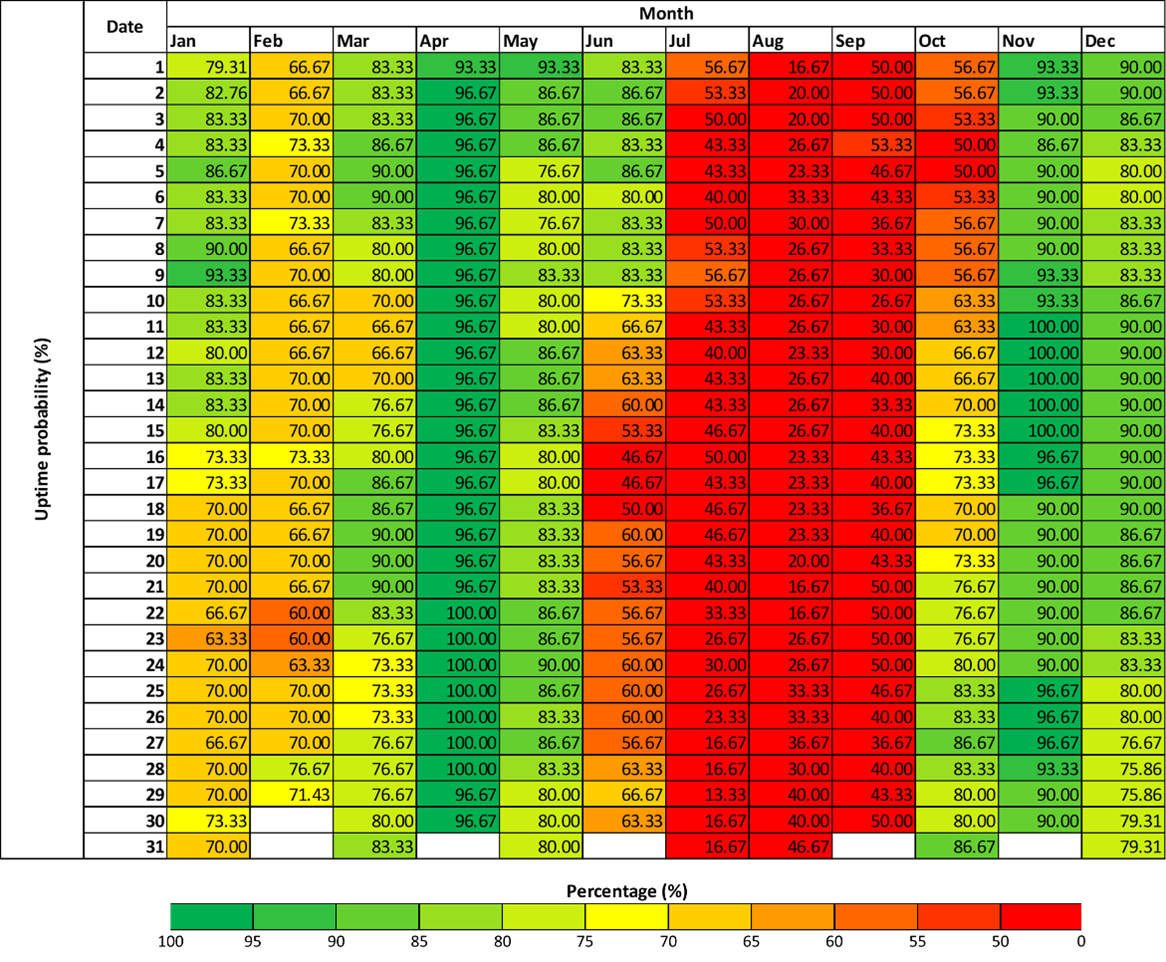
After several opportunities to deliver this service, we have improved our type of deliverables to have an additional basis of uptime probability. Our client that actively used our weather window gave testimony that the weather window would be more suited to their operation plan when it can state which exact dates are estimated as safety operation days. Therefore, we have now developed the 2nd form of weather window, shows on Figure 2 below. In this form, we can see how the safety probability of operation days (it can be 1-, or 3-, or 7-, or 16- consecutive days) is if it started on a certain date. This is how this form is read: On January 1st, the uptime probability to have a safe operation for 7 days (January 1st – 7th) is 79.31%. On January 2nd, the uptime probability to have a safe operation for 7 days (January 2nd – 8th) is 82.76%. And so, on January 31st, the uptime probability to have a safe operation for 7 days (January 31st – February 6th) is 70.00%.
The two forms surely have their advantage and minor. Using irst form, we can carefully review which month is the best possible choice to conduct some operation by comparing each month’s probability within the same days’ consecutive. While in form 2, we can be able to determine each day’s probability. This option is the best option if you (and your team) already know the specified operating time range, such as always for 1 day, 2 days, etc. This operation setting can also be adjusted based on the client’s preference ranging between 1 to 30 consecutive days.
On top of that, we are currently continuous on improve our accuracy by actively comparing our weather window product’s accuracy with actual condition in the field. Then, have you now understood the need for a weather window? Have you found how this service would help your needs? And which form of weather window would be the best for your operation planning? Let us know your opinion and please hit us up should you have further questions. Also available the Marine Sea State Prediction and Tow/Rig Move Forecast, as our daily forecast to give you more comprehensive information about how the weather and the sea state condition would be for the seven or ten days ahead.
