It Should Be Dry Season Now. So Why Are Floods Happening Everywhere? Let Us Explain.
(AF | 11/07/2025)
Indonesia, as a tropical archipelago, experiences two dominant seasons: the rainy season and the dry season. Typically, the rainy season spans December to February, while the dry season occurs between June and August. Transitional periods, from March to May and from September to November, bridge the shift between the two. This cycle is governed by monsoonal winds: moist winds from Asia (the Asian monsoon) bring rain, while dry winds from Australia (the Australian monsoon) usher in the dry season.
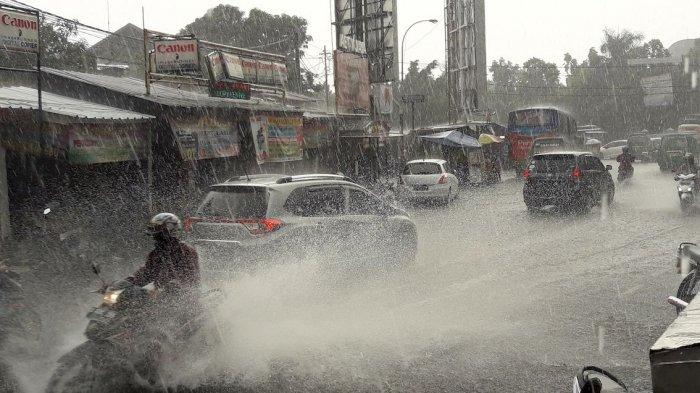
However, reality often deviates from expectations. Since April 2025, which marks the start of the dry transition, many regions in Indonesia have suffered from unusually intense rainfall, flash floods, and landslides. The National Disaster Management Agency (BNPB) recorded 232 flood events and 83 instances of extreme weather between April 1 and June 3, 2025. Recorded flood events mainly occurred in Java, while severe incidents were happening in Kalimantan, Sulawesi, and Java where thousands of homes flooded. These numbers are unusually high for what should be a drier time of year. So, what’s going on?
Some analyses point to environmental issues—deforestation, degraded watersheds, and poor urban drainage. However, there is also a strong atmospheric explanation. A recent report by CNN Indonesia (June 3, 2025) termed this situation a “wet dry season” (“kemarau basah”), attributing it to active equatorial atmospheric waves such as the Madden-Julian Oscillation (MJO), Kelvin waves, and Equatorial Rossby waves. These natural phenomena can temporarily override typical seasonal patterns and lead to excessive rainfall—even during the dry season.
Let’s break these down.
1. Madden-Julian Oscillation (MJO)
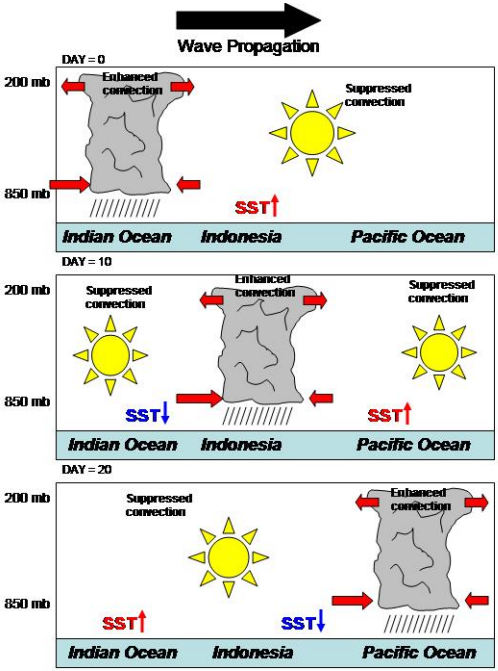
The MJO is a massive tropical weather pattern that moves eastward from the Indian Ocean across the Pacific roughly every 30–60 days. It alternates between “active” and “suppressed” convective phases. When active, it brings more cloud cover, thunderstorms, and rainfall—especially across the Maritime Continent, including Indonesia.
During its active phase, the MJO significantly amplifies rainfall and flood risk. In fact, research shows that in the boreal summer (June–August), regions in western and northern Indonesia can experience an 80% increase in extreme rain events during active MJO periods (Fadhlil et al., 2020).
According to the Australian Bureau of Meteorology, Indonesia experienced active MJO phases in mid-January, early February, and mid-March 2025, contributing to higher-than-average rainfall.
2. Kelvin Waves
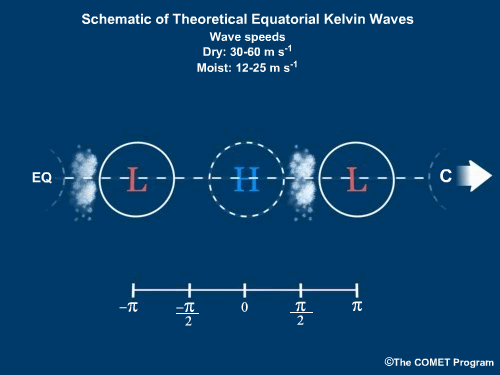
Convectively Coupled Kelvin Waves (CCKWs) are eastward-moving equatorial waves that transport heat and moisture. They’re faster than the MJO and typically have a , typically around 10-20 days, but their impact is immediate. When CCKWs pass over Indonesia, they can enhance convection and trigger heavy rainfall within a span of a few days.
These waves are especially influential when they coincide with MJO activity, amplifying rain intensity and storm formation. Indonesia’s complex topography and diurnal heat patterns (daytime heating and nighttime cooling) make it particularly vulnerable to flash floods under this combined influence (Lubis et al., 2021; Straub & Kiladis, 2003).
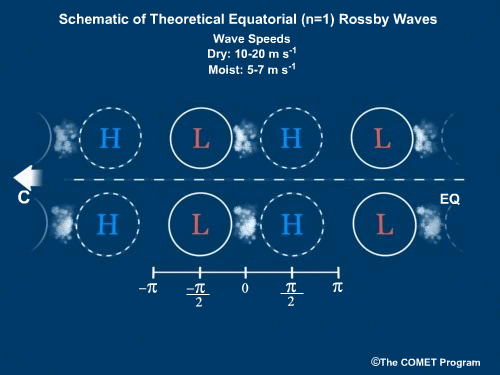
3. Equatorial Rossby (ER) Waves
ER waves are slow-moving, westward-propagating systems that influence tropical rainfall through widespread moisture convergence. Although they don’t spike rainfall as sharply as Kelvin waves, their can lead to prolonged wet conditions, especially when interacting with other wave systems and local convection (Kiladis et al., 2009). ER can sustain 10-50 days, averaging in between 20-30 days.
When ER waves overlap with MJO or Kelvin waves, the cumulative effect can dramatically extend the duration and intensity of rainfall—even in months when precipitation is normally low.
Putting It All Together: Why It’s Raining During the Dry Season
Based on the explanation above, these three atmospheric phenomena, Madden-Julian Oscillation (MJO), Kelvin waves, and Equatorial Rossby waves, can significantly increase rainfall intensity across Indonesia. The MJO is closely monitored by international agencies such as the Australian Bureau of Meteorology and the National Oceanic and Atmospheric Administration (NOAA) through established indices and forecasts. However, there are currently no standardized monitoring tools or operational indices specifically for detecting Kelvin and Rossby waves in real-time. This highlights the need for further research and advancements in atmospheric monitoring to better track and predict these phenomena.
When all three phenomena become active simultaneously over Indonesia, they can reinforce one another, creating conditions highly favorable for extreme rainfall, even during the dry season. This overlapping effect is likely one of the main causes behind the recent heavy rains and floods during what should have been a drier period. Additionally, other climate factors such as La Niña may also contribute to this anomaly. These overlapping systems can reinforce each other, disrupting the typical monsoon-driven dry pattern and causing unseasonal weather extremes. This combination of events has led many experts and media outlets to label the current situation as a “wet dry season” or “musim kemarau basah.”
However, it is important to note that this explanation remains a scientific hypothesis based on observational patterns and theoretical understanding and has not yet been fully validated through comprehensive empirical studies.
According to the Indonesian Meteorological Agency (BMKG) in an article published on 28 May 2025, a “wet dry season” is likely to persist in parts of Indonesia through August 2025. This anomaly is influenced by several large-scale atmospheric and oceanic factors, including the lingering effects of La Niña, a negative Indian Ocean Dipole, warmer-than-average sea surface temperatures, and active monsoonal winds. In addition, sub-seasonal tropical disturbances, such as the Madden-Julian Oscillation (MJO), Kelvin waves, and Equatorial Rossby waves, are contributing to enhanced convection and above-normal rainfall during what is typically the dry season. BMKG reports that approximately 57.7% of Indonesia’s seasonal zones entered the dry season between April and June 2025. However, continued rainfall in many of these regions, combined with the projection that around 43% of zones will experience a shorter-than-average dry season, underscores the importance of monitoring these dynamic atmospheric patterns. The transitional season is expected around September to November, with the rainy season likely resuming by December 2025.
What Happens Next and What Should We Do?
Multiple leading climate centers (NOAA CPC, IRI, WMO) agree that ENSO‑neutral conditions prevail and are expected to persist through the Northern Hemisphere summer, with probabilities ranging from 74% to 82%. This shift diminishes La Niña’s influence, making sub-seasonal phenomena like the MJO the primary drivers of continued heavy rainfall, with the potential for continued wet conditions across much of Indonesia.
Residents are advised to stay vigilant, particularly in flood-prone and landslide-prone areas. In addition to carrying rain gear and being cautious during outdoor activities, it is strongly recommended to regularly monitor official weather forecasts and early warning systems from trusted sources such as BMKG or local authorities. Many extreme weather events now develop quickly, and timely updates can provide critical time to prepare.
Furthermore, for those living in high-risk areas, it’s advisable to:
- Prepare emergency kits with essentials like food, water, flashlights, and first-aid supplies.
- Identify safe evacuation routes and emergency shelters in advance.
- Avoid traveling near rivers or steep hillsides during heavy rains.
- Ensure that drainage systems around homes are clear to minimize flood risk.
- Stay informed not just about daily weather, but also about sub-seasonal outlooks (such as weekly to monthly forecasts), which are now more accessible via BMKG apps or local disaster management agencies.
Small actions, such as checking the forecast before leaving home, can make a significant difference during this unpredictable “wet dry season.”
Final Thoughts
The interaction between large-scale atmospheric systems plays a critical role in natural disaster risk, often outweighing local seasonal expectations. For industries, governments, and communities that rely on accurate seasonal planning, understanding and monitoring these metocean dynamics is essential.
For tailored support, consulting services, and real-time weather analysis, contact PT Bhumi Warih Geohydromatics, your trusted metocean specialist.
📧 Email: bw@bwgeohydromatics.com or metocean@bwgeohydromatics.com
References
Australian Bureau of Meteorology. (n.d.). Australian climate influences: Madden-Julian Oscillation. Retrieved from http://www.bom.gov.au/climate/about/australian-climate-influences.shtml?bookmark=mjo
Australian Bureau of Meteorology. (2025). Madden-Julian Oscillation index and forecasts. Retrieved from http://www.bom.gov.au/climate/mjo/#tabs=Outlooks
BMKG. (2022). Pengaruh Madden-Julian Oscillation (MJO) terhadap Cuaca di Indonesia. Badan Meteorologi, Klimatologi, dan Geofisika. Retrieved from https://www.bmkg.go.id
BMKG. (2025, May 28). Musim kemarau basah: Fenomena, penyebab, dan dampaknya di Indonesia. Badan Meteorologi, Klimatologi, dan Geofisika. Retrieved from https://gaw-bariri.bmkg.go.id/index.php/karya-tulis-dan-artikel/artikel/265-musim-kemarau-basah-fenomena-penyebab-dan-dampaknya-di-indonesia
BNPB. (2025). Data kejadian bencana 1 April–3 Juni 2025. Retrieved from https://gis.bnpb.go.id/databencana/tabel/pencarian.php
CNN Indonesia. (2025, June 3). Kemarau basah sampai kapan? Ini prediksinya. Retrieved from https://www.cnnindonesia.com/teknologi/20250603053347-641-1235729/kemarau-basah-sampai-kapan-ini-prediksinya
Fadhlil, R. M., Lubis, S. W., & Setiawan, S. (2020). Impacts of the Madden–Julian Oscillation on precipitation extremes in Indonesia. Journal of Climate, 33(5), 2043–2057. https://doi.org/10.1175/JCLI-D-19-0376.1
GoodStats. (2025). Catatan bencana alam di Indonesia pada 2025, banjir mendominasi. Retrieved from https://goodstats.id/article/catatan-bencana-alam-di-indonesia-pada-2025-banjir-mendominasi-eg5hd
International Research Institute for Climate and Society. (2025, May). ENSO prediction plume: Forecast probabilities and model outputs. Columbia University. Retrieved from https://iri.columbia.edu/our-expertise/climate/forecasts/enso/current/
Kiladis, G. N., Wheeler, M. C., Haertel, P. T., Straub, K. H., & Roundy, P. E. (2009). Convectively coupled equatorial waves. Reviews of Geophysics, 47(2), RG2003. https://doi.org/10.1029/2008RG000266
Lubis, S. W., Fadhlil, M., & Setiawan, S. (2021). Dynamical influence of equatorial waves on rainfall variability in the Indonesian Maritime Continent. Journal of Atmospheric and Solar-Terrestrial Physics, 215, 105586. https://doi.org/10.1016/j.jastp.2020.105586
Madden, R. A., & Julian, P. R. (1971). Detection of a 40–50 day oscillation in the zonal wind in the tropical Pacific. Journal of the Atmospheric Sciences, 28(5), 702–708. https://doi.org/10.1175/1520-0469(1971)028<0702:DOADOI>2.0.CO;2
National Oceanic and Atmospheric Administration. (2025, June 12). ENSO Diagnostic Discussion. Climate Prediction Center. Retrieved from https://www.cpc.ncep.noaa.gov/products/analysis_monitoring/enso_advisory/
NOAA Climate Prediction Center & International Research Institute for Climate and Society. (2025, May 9). ENSO Outlook – Official Probabilistic Forecast. Retrieved from https://iri.columbia.edu/our-expertise/climate/forecasts/enso/current/
Peatman, S. C., Matthews, A. J., & Stevens, D. P. (2014). Propagation of the Madden–Julian Oscillation through the Maritime Continent and scale interaction with the diurnal cycle of precipitation. Quarterly Journal of the Royal Meteorological Society, 140(680), 814–825. https://doi.org/10.1002/qj.2161
Straub, K. H., & Kiladis, G. N. (2003). Interannual variability of convectively coupled equatorial waves and its relation to the Madden–Julian Oscillation. Journal of Climate, 16(3), 435–456. https://doi.org/10.1175/1520-0442(2003)016<0435:IVOCCE>2.0.CO;2
World Meteorological Organization. (2025, May 27). Global Seasonal Climate Update: ENSO and Climate Drivers – May 2025 Edition. Retrieved from https://public.wmo.int/en/media/news/global-seasonal-climate-update-may-2025
