Metocean Atlas: Simple Yet Comprehensive Climate Outlook
Metocean Atlas: Simple Yet Comprehensive Climate Outlook

(AR | 09/02/2023)
Meteorology and oceanographical (metocean) data such as wind, wave, current, etc. are critical for coastal and offshore infrastructures design, reliability, and safe operability. Therefore, mastery of the metocean data is undoubtedly needed by companies to plan their operations. With Metocean Atlas, we can get a better understanding of the characteristics of the climate outlook in the operational area and in several preferred points of interest.
Metocean Atlas is one of many services from BWGeohydromatics which offers a simple monthly general climate condition, delivering characteristics of metocean parameter in a full year. The metocean parameters analyzed in this service consist of wind, waves, currents, and precipitation. This service provides a monthly spatial condition of the Metocean parameters, statistical analysis to describe ambient conditions, and an operation time window that shows uptime probability of operations. The data and analysis provided can be used as a reference for operation planning so that the productivity and safety of the operations can be well maintained, and the risk of damage can be lowered.
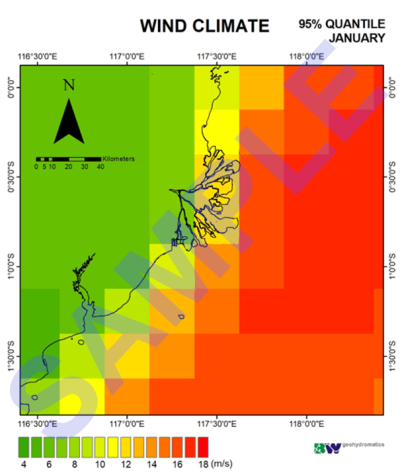
Our Metocean Atlas provides three deliverables which are Climate Atlas, Ambient Condition, and Operation Time. The Climate Atlas is presented as a spatial map for upper (95%) quantile by using the historical condition of monthly wind, wave, current, and 3-hourly precipitation.
The Ambient Condition is presented in the form of a frequency distribution table and statistical values (i.e., maximum, average, and minimum) on monthly basis as shown in table below. From the ambient condition, we can find out the statistics of waves, wind, currents, and precipitation at the point of interest as shown in tables 1 and 2 below.
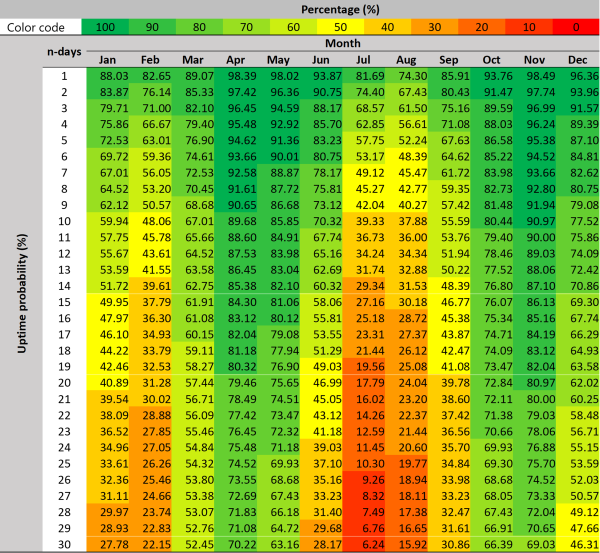
The operation time is presented in downtime days and uptime probability. Downtime days are generated when data passes a certain threshold. The threshold is customized according to the objective and considerations as a scenario plans. With the uptime probability presented in table 3, you can determine the best time to conduct an operation.
“Meet our needs very well, responsive, open to any discussion, and meet the expected deliverables excellently,” said one of our client’s who is based in eastern Kalimantan site and actively using our metocean atlas service. We are very pleased and feel insightful to hear that the service is beneficial and useful to support operation and planning for our client in the latest project.
Metocean Atlas can give you a simple yet thorough climate outlook for your needs. It should be noted that the Metocean Atlas is not a forecast, but more of a climate outlook based on the historical metocean behavior from decades back. If you need a comprehensive metocean data outlook in your operation, BW will be delivering all the information you need to make key decisions and reduces the operation risk using the Metocean Atlas. You can find more information about our other metocean design criteria services here.


