Our Tidal Prediction for Offshore Drilling

(SC | 05/10/2021)
Tide is a periodic rise and fall of seawater surface level that is caused by long-term gravitational interactions between the moon, sun, and earth. To simplify, a high tide occurs when the moon is closer to the earth and vice-versa. However, short-term meteorological factors such as severe weather can also drive the variabilities of seawater levels.
Both coastal and offshore waterways play a critical economic role in terms of shipping, oil and gas production, fisheries, even tourism activities. Thus, precise knowledge of tidal and water fluctuation and circulation is important to reduce risks, to plan and maintain safe marine navigation as well as ocean and coastal engineering works.
Tidal prediction has become one of BW’s specialties to support decision-making in marine operational, especially in offshore drilling. One of our clients, a Senior Drilling Engineer, Borman Subroto, Mr., said: the presence of tidal prediction is not only beneficial during operation but also for planning the offshore works in North Sumatra Basin. Given the tidal information, clients can analyze the situation before the offshore drilling process, for example, to plan the pinpoint of the drilling instrument when the tidal prediction is at the lowest and at the highest.
Tidal prediction is best obtained using harmonic analysis of site survey tidal observation. However, there are situations that will prevent us to conduct a survey such as location difficulties, budget limitations, etc. To substitute that, we provide a tidal prediction based on secondary data processed using a least squared method. The actual water level may vary from the predicted water level due to the variabilities of meteorological conditions.
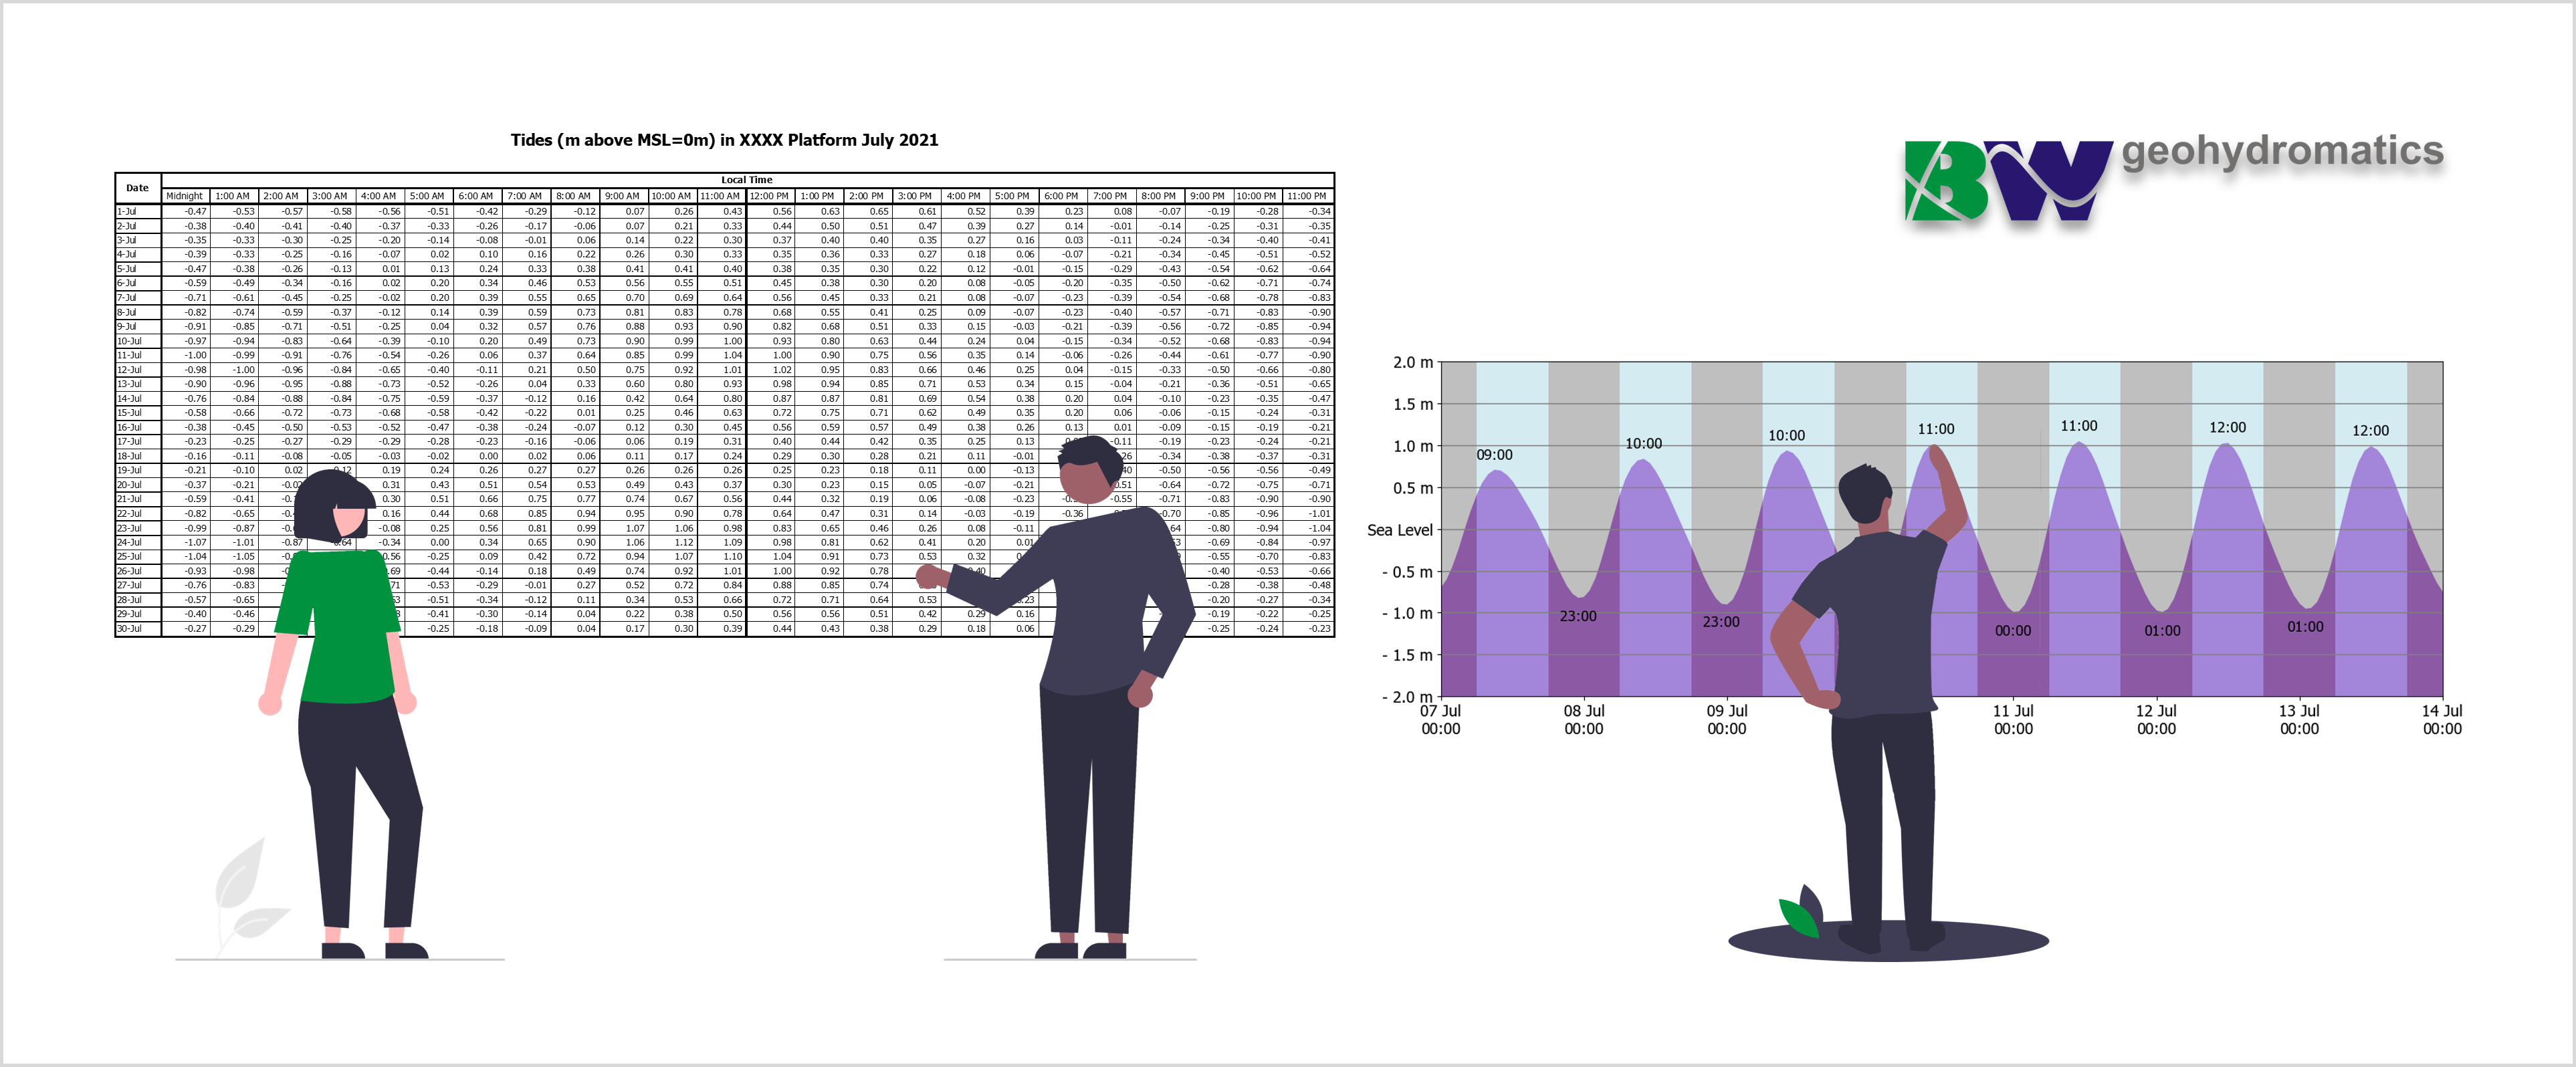
The tidal prediction data is usually presented in two types of data visualization, which are in table and time series chart. Both will give information on tide levels in a certain period. The tide table contains detailed information while the time series chart will give a quick overview of the highest and lowest tide, so the readers could grasp the information efficiently as well as comparing the height in a certain period.
What can we provide regarding the deliverables of tidal prediction? In the last project, we supported an offshore drilling project with tidal datum information (HAT, MHWS, MHWN, MSL, MLWN, MLWS, and LAT), monthly tidal prediction tables, and weekly tidal prediction charts within certain period. All the tables, charts, and reference unit were customized to meet the client’s interest. The time series chart also contains marks on the daily highest and daily lowest of tidal level. Those represent the simplest way to compile tidal prediction data, yet the deliverables are not limited to what has been mentioned. A sample report of tide prediction information can be seen here.
